

Introduction
Background
Globally, the 20th century was marked by: (a) two devastating World Wars; (b) the Great Depression of the 1930s; (c) the end of vast colonial empires; (d) rapid advances in science and technology; (e) the Cold War between the Western alliance and the Warsaw Pact nations; (f) a sharp rise in living standards in North America, Europe, and Japan; (g) increased concerns about environmental degradation including deforestation, energy and water shortages, declining biological diversity, and air pollution; and (h) the ultimate emergence of the US as the only world superpower. The planet's population continues to expand at a fast rate: from 1 billion in 1820 to 2 billion in 1930, 3 billion in 1960, 4 billion in 1974, 5 billion in 1987, 6 billion in 1999, 7 billion in 2012, and 8 billion in 2022. For the 21st century, the continued exponential growth in science and technology raises both hopes (e.g., advances in medicine and agriculture) and fears (e.g., development of even more lethal weapons of war).
Visit the Definitions and Notes page to view a description of each topic.
Geography
Geographic overview
The surface of the Earth is approximately 70.9% water and 29.1% land. The water portion is the World Ocean, the single largest feature of the planet and one that connects all places on the globe. The continental landmasses divide this ocean into five major ocean basins, which are (in decreasing order of size) the Pacific, Atlantic, Indian, Southern, and Arctic. The World Factbook describes these five as oceans. Because of the major ocean currents and the effects of the major air masses above them, the Pacific and Atlantic Oceans are generally divided at the equator into the North and South Pacific Oceans and the North and South Atlantic Oceans, creating seven major water bodies -- the so-called "Seven Seas."
About 97.5% of the Earth's water is saltwater. Of the 2.5% that is fresh, about two thirds is frozen, mostly locked up in mountain glaciers and the Antarctic ice sheets. If all the surface ice on earth fully melted, the sea level would rise about 70 m (230 ft).
Earth's land portion is divided into landmasses called continents. Different continental definitions are recognized in certain parts of the world, with some more heavily based on culture than physical geography.
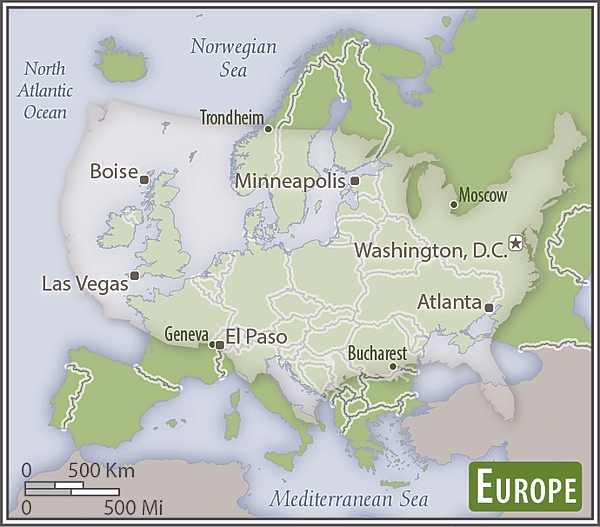
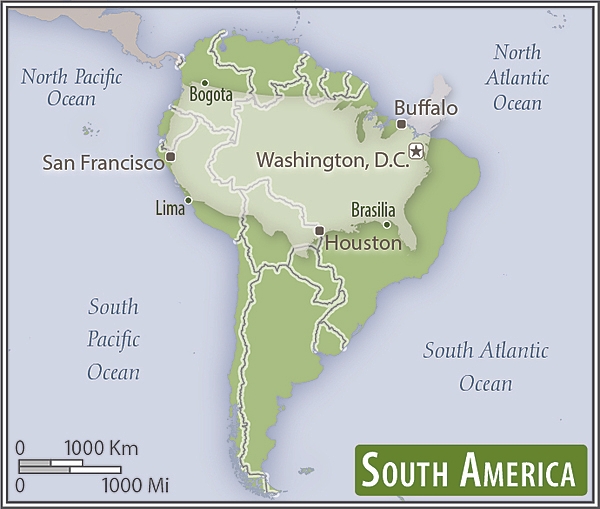
Depending on the convention used, the number of continents can vary from five to seven. The most common classification recognizes seven, which are (from largest to smallest) Asia, Africa, North America, South America, Antarctica, Europe, and Australia. Asia and Europe are sometimes lumped together into a Eurasian continent, and North and South America are sometimes grouped as the Americas, with either usage resulting in a continent total of six (or five, if both are used).
North America is commonly understood to include Greenland and the Caribbean islands and to extend south to the Isthmus of Panama. The Ural Mountains and the Ural River are usually considered the easternmost part of Europe, the Caspian Sea is the limit to the southeast, and the Caucasus Mountains, the Black Sea, and the Mediterranean to the south. Asia usually incorporates all the islands of the Philippines, Malaysia, and Indonesia. The Pacific islands are often lumped with Australia and designated as Oceania or Australasia. Africa's northeast extremity is frequently delimited at the Isthmus of Suez, but for geopolitical purposes, the Egyptian Sinai Peninsula is often included as part of Africa.
In total, the United States recognizes 197 countries. Using the seven-continent model and grouping islands with adjacent continents, Africa has the most countries with 54. Europe has 49 countries and Asia 48, with five countries shared: Azerbaijan, Georgia, Kazakhstan, Russia, and Turkey. North America has 23, Oceania has 16, and South America has 12.
countries by continent: Africa (54): Algeria, Angola, Benin, Botswana, Burkina Faso, Burundi, Cabo Verde, Cameroon, Central African Republic, Chad, Comoros, Democratic Republic of the Congo, Republic of the Congo, Cote d'Ivoire, Djibouti, Egypt, Equatorial Guinea, Eritrea, Eswatini, Ethiopia, Gabon, The Gambia, Ghana, Guinea, Guinea-Bissau, Kenya, Lesotho, Liberia, Libya, Madagascar, Malawi, Mali, Mauritania, Mauritius, Morocco, Mozambique, Namibia, Niger, Nigeria, Rwanda, Sao Tome and Principe, Senegal, Seychelles, Sierra Leone, Somalia, South Africa, South Sudan, Sudan, Tanzania, Togo, Tunisia, Uganda, Zambia, Zimbabwe
Europe (49): Albania, Andorra, Austria, Azerbaijan*, Belarus, Belgium, Bosnia and Herzegovina, Bulgaria, Croatia, Czech Republic, Denmark, Estonia, Finland, France, Georgia*, Germany, Greece, Holy See (Vatican City), Hungary, Iceland, Ireland, Italy, Kazakhstan*, Kosovo, Latvia, Liechtenstein, Lithuania, Luxembourg, Malta, Moldova, Monaco, Montenegro, Netherlands, North Macedonia, Norway, Poland, Portugal, Romania, Russia*, San Marino, Serbia, Slovakia, Slovenia, Spain, Sweden, Switzerland, Turkey*, Ukraine, United Kingdom (* indicates part of the country is also in Asia)
Asia (48): Afghanistan, Armenia, Azerbaijan*, Bahrain, Bangladesh, Bhutan, Brunei, Burma, Cambodia, China, Cyprus, Georgia*, India, Indonesia, Iran, Iraq, Israel, Japan, Jordan, Kazakhstan*, North Korea, South Korea, Kuwait, Kyrgyzstan, Laos, Lebanon, Malaysia, Maldives, Mongolia, Nepal, Oman, Pakistan, Philippines, Qatar, Russia*, Saudi Arabia, Singapore, Sri Lanka, Syria, Tajikistan, Thailand, Timor-Leste, Turkey*, Turkmenistan, United Arab Emirates, Uzbekistan, Vietnam, Yemen (* indicates part of the country is also in Europe)
North America (23): Antigua and Barbuda, The Bahamas, Barbados, Belize, Canada, Costa Rica, Cuba, Dominica, Dominican Republic, El Salvador, Grenada, Guatemala, Haiti, Honduras, Jamaica, Mexico, Nicaragua, Panama, Saint Kitts and Nevis, Saint Lucia, Saint Vincent and the Grenadines, Trinidad and Tobago, United States
Oceania (16): Australia, Cook Islands, Fiji, Kiribati, Marshall Islands, Federated States of Micronesia, Nauru, New Zealand, Niue, Palau, Papua New Guinea, Samoa, Solomon Islands, Tonga, Tuvalu, Vanuatu
South America (12): Argentina, Bolivia, Brazil, Chile, Colombia, Ecuador, Guyana, Paraguay, Peru, Suriname, Uruguay, Venezuela
Three of the states described above – France, Netherlands, and the United Kingdom – consist of smaller political entities that are referred to as countries. France considers French Polynesia an overseas country; the Kingdom of the Netherlands refers to all four of its constituent parts (the Netherlands and the islands of Aruba, Curacao, and Sint Maarten) as countries; and the United Kingdom is composed of the countries of England, Wales, Scotland, and Northern Ireland.
the World from space: Earth is the only planet in the solar system to have water in its three states of matter: liquid (oceans, lakes, and rivers), solid (ice), and gas (water vapor in clouds). From a distance, Earth would be the brightest of the eight planets in the solar system because of the planet's water reflecting sunlight.
Earth has a slight equatorial bulge -- a difference between its equatorial and polar diameters -- because of the centrifugal force from the planet rotating on its axis. The equatorial diameter is 12,756 km, but the polar diameter is 12,714 km; the circumference at the equator is 40,075 km, and the polar circumference is 40,008 km.
Area
total : 510.072 million sq km
land: 148.94 million sq km
water: 361,899,999 sq km
note: 70.9% of the world's surface is water, 29.1% is land
Area - comparative
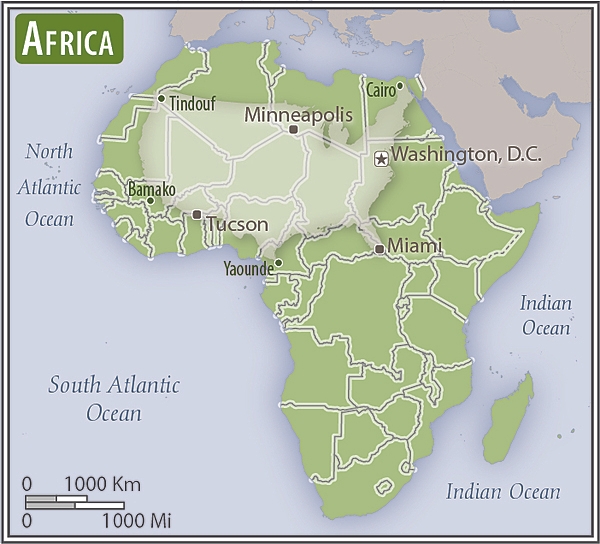
land area about 16 times the size of the US


Area - rankings
top fifteen World Factbook entities ranked by size: Pacific Ocean 155,557,000 sq km; Atlantic Ocean 76,762,000 sq km; Indian Ocean 68,556,000 sq km; Southern Ocean 20,327,000 sq km; Russia 17,098,242 sq km; Antarctica 14,200,000 sq km; Arctic Ocean 14,056,000 sq km; Canada 9,984,670 sq km; United States 9,826,675 sq km; China 9,596,960 sq km; Brazil 8,515,770 sq km; Australia 7,741,220 sq km; European Union 4,324,782 sq km; India 3,287,263 sq km; Argentina 2,780,400 sq km
top ten largest water bodies: Pacific Ocean 155,557,000 sq km; Atlantic Ocean 76,762,000 sq km; Indian Ocean 68,556,000 sq km; Southern Ocean 20,327,000 sq km; Arctic Ocean 14,056,000 sq km; Coral Sea 4,184,100 sq km; South China Sea 3,595,900 sq km; Caribbean Sea 2,834,000 sq km; Bering Sea 2,520,000 sq km; Mediterranean Sea 2,469,000 sq km
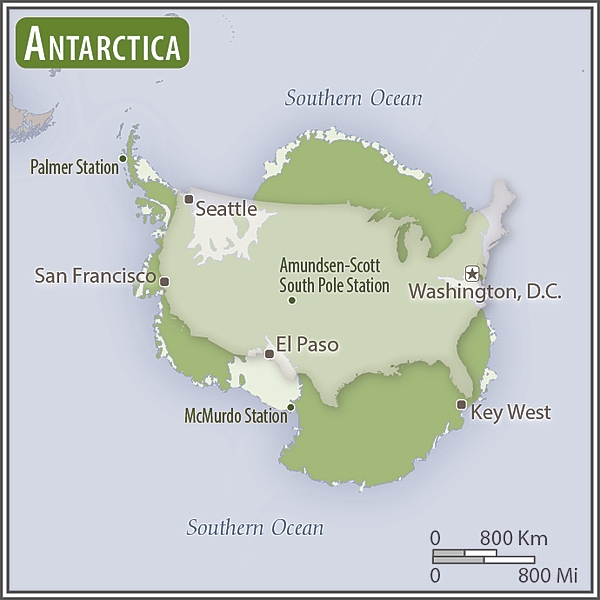
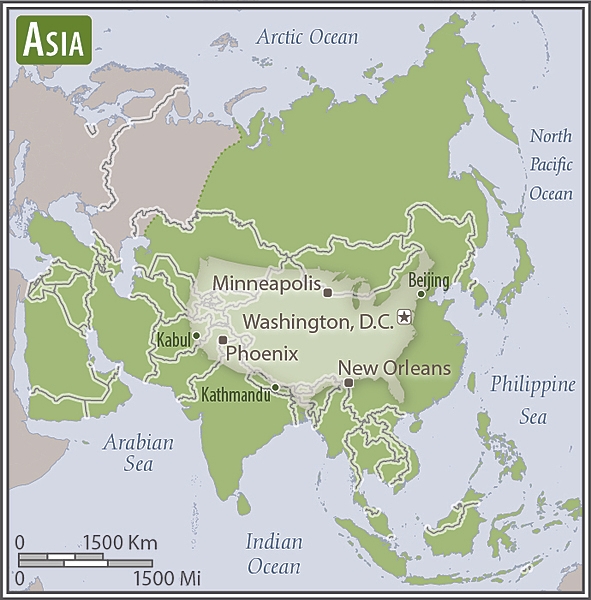
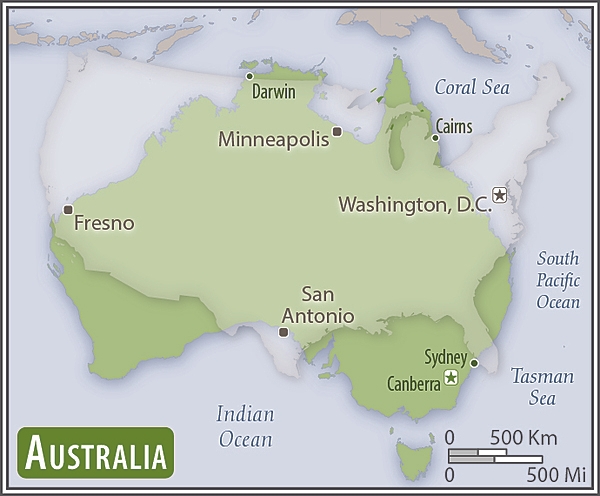
top ten largest landmasses: Asia 44,568,500 sq km; Africa 30,065,000 sq km; North America 24,473,000 sq km; South America 17,819,000 sq km; Antarctica 14,200,000 sq km; Europe 9,948,000 sq km; Australia 7,741,220 sq km; Greenland 2,166,086 sq km; New Guinea 785,753 sq km; Borneo 751,929 sq km
top ten largest islands: Greenland 2,166,086 sq km; New Guinea (Indonesia, Papua New Guinea) 785,753 sq km; Borneo (Brunei, Indonesia, Malaysia) 751,929 sq km; Madagascar 587,713 sq km; Baffin Island (Canada) 507,451 sq km; Sumatra (Indonesia) 472,784 sq km; Honshu (Japan) 227,963 sq km; Victoria Island (Canada) 217,291 sq km; Great Britain (United Kingdom) 209,331 sq km; Ellesmere Island (Canada) 196,236 sq km
top ten longest* mountain ranges (land-based): Andes (Venezuela, Colombia, Ecuador, Peru, Bolivia, Chile, Argentina) 7,000 km; Rocky Mountains (Canada, US) 4,830 km; Great Dividing Range (Australia) 3,700 km; Transantarctic Mountains (Antarctica) 3,500 km; Kunlun Mountains (China) 3,000 km; Ural Mountains (Russia, Kazakhstan) 2,640 km; Atlas Mountains (Morocco, Algeria, Tunisia) 2,500 km; Appalachian Mountains (Canada, US) 2,400 km; Himalayas (Pakistan, Afghanistan, India, China, Nepal, Bhutan) 2,300 km; Altai Mountains (Kazakhstan, Russia, Mongolia) 2,000 km
*lengths are approximate; if oceans are included, the Mid-Ocean Ridge is by far the longest mountain range at 40,389 km
top ten largest forested countries (sq km and percent of land): Russia 8,149,310 (49.8%); Brazil 4,935,380 (58.9%); Canada 3,470,690 (38.2%); United States 3,103,700 (33.9%); China 2,098,640 (22.3%); Democratic Republic of the Congo 1,522,670 (67.2%); Australia 1,250,590 (16.3%); Indonesia 903,250 (49.9%); Peru 738,054 (57.7%); India 708,600 (23.8%) (2016 est.)
top ten most densely forested countries (percent of land): Suriname (98.3%), Federated States of Micronesia (91.9%), Gabon (90%), Seychelles (88.4%), Palau (87.6%), Guyana (83.9%), Laos (82.1%), Solomon Islands (77.9%), Papua New Guinea (74.1%), Finland (73.1%) (2016 est.)
top ten largest (non-polar*) deserts: Sahara (Algeria, Chad, Egypt, Libya, Mali, Mauritania, Niger, Western Sahara, Sudan, Tunisia) 9,200,000 sq km; Arabian (Saudi Arabia, Iraq, Jordan, Kuwait, Oman, Qatar, United Arab Emirates, Yemen) 2,330,000 sq km; Gobi (China, Mongolia) 1,295,000 sq km; Kalahari (Botswana, Namibia, South Africa) 900,000 sq km; Patagonian (Argentina) 673,000 sq km; Syrian (Syria, Iraq, Jordan, Saudi Arabia) 500,000 sq km; Chihuahuan (Mexico) 362,000 sq km; Kara-Kum (Turkmenistan) 350,000 sq km; Great Victoria (Australia) 348,750 sq km; Great Basin (United States) 343,169 sq km
*if the two polar deserts were included, they would rank first and second: Antarctic Desert 14,200,000 sq km and Arctic Desert 13,900,000 sq km
ten smallest independent countries: Holy See (Vatican City) 0.44 sq km; Monaco 2 sq km; Nauru 21 sq km; Tuvalu 26 sq km; San Marino 61 sq km; Liechtenstein 160 sq km; Marshall Islands 181 sq km; Cook Islands 236 sq km; Niue 260 sq km; Saint Kitts and Nevis 261 sq km
Land boundaries
the land boundaries in The World Factbook total 279,035.5 km (not counting shared boundaries twice), but the number is only an estimate because of the difficulty in precisely measuring natural features such as rivers
note 1: 46 nations and other areas are landlocked, these include: Afghanistan, Andorra, Armenia, Austria, Azerbaijan, Belarus, Bhutan, Bolivia, Botswana, Burkina Faso, Burundi, Central African Republic, Chad, Czechia, Eswatini, Ethiopia, Holy See (Vatican City), Hungary, Kazakhstan, Kosovo, Kyrgyzstan, Laos, Lesotho, Liechtenstein, Luxembourg, North Macedonia, Malawi, Mali, Moldova, Mongolia, Nepal, Niger, Paraguay, Rwanda, San Marino, Serbia, Slovakia, South Sudan, Switzerland, Tajikistan, Turkmenistan, Uganda, Uzbekistan, West Bank, Zambia, Zimbabwe; two of these, Liechtenstein and Uzbekistan, are doubly landlocked
note 2: worldwide, about one quarter of interior (non-coastal) borders are rivers; South America with 43% leads the continents, followed by North America with 32%, Africa with 30%, Europe with 23%, and Asia with 18%; Australia has no interior national river borders
note 3: two nations, China and Russia, each border 14 other countries
Coastline
356,000 km
note: 95 nations and other entities are islands that border no other countries: American Samoa, Anguilla, Antigua and Barbuda, Aruba, Ashmore and Cartier Islands, The Bahamas, Bahrain, Baker Island, Barbados, Bermuda, Bouvet Island, British Indian Ocean Territory, British Virgin Islands, Cabo Verde, Cayman Islands, Christmas Island, Clipperton Island, Cocos (Keeling) Islands, Comoros, Cook Islands, Coral Sea Islands, Cuba, Curacao, Cyprus, Dominica, Falkland Islands (Islas Malvinas), Faroe Islands, Fiji, French Polynesia, French Southern and Antarctic Lands, Greenland, Grenada, Guam, Guernsey, Heard Island and McDonald Islands, Howland Island, Iceland, Isle of Man, Jamaica, Jan Mayen, Japan, Jarvis Island, Jersey, Johnston Atoll, Kingman Reef, Kiribati, Madagascar, Maldives, Malta, Marshall Islands, Mauritius, Mayotte, Federated States of Micronesia, Midway Islands, Montserrat, Nauru, Navassa Island, New Caledonia, New Zealand, Niue, Norfolk Island, Northern Mariana Islands, Palau, Palmyra Atoll, Paracel Islands, Philippines, Pitcairn Islands, Puerto Rico, Saint Barthelemy, Saint Helena, Saint Kitts and Nevis, Saint Lucia, Saint Pierre and Miquelon, Saint Vincent and the Grenadines, Samoa, Sao Tome and Principe, Seychelles, Singapore, Sint Maarten, Solomon Islands, South Georgia and the South Sandwich Islands, Spratly Islands, Sri Lanka, Svalbard, Taiwan, Tokelau, Tonga, Trinidad and Tobago, Turks and Caicos Islands, Tuvalu, Vanuatu, Virgin Islands, Wake Island, Wallis and Futuna
Maritime claims
most countries make the following claims measured from the mean low-tide baseline as described in the 1982 UN Convention on the Law of the Sea: territorial sea - 12 nm, contiguous zone - 24 nm, and exclusive economic zone - 200 nm; additional zones provide for exploitation of continental shelf resources and an exclusive fishing zone; boundary situations with neighboring states prevent many countries from extending their fishing or economic zones to a full 200 nm
Climate
a wide equatorial band of hot and humid tropical climates is bordered north and south by subtropical temperate zones that separate two large areas of cold and dry polar climates
ten driest places on Earth (average annual precipitation): McMurdo Dry Valleys, Antarctica 0 mm (0 in)
Arica, Chile 0.76 mm (0.03 in)
Al Kufrah, Libya 0.86 mm (0.03 in)
Aswan, Egypt 0.86 mm (0.03 in)
Luxor, Egypt 0.86 mm (0.03 in)
Ica, Peru 2.29 mm (0.09 in)
Wadi Halfa, Sudan 2.45 mm (0.1 in)
Iquique, Chile 5.08 mm (0.2 in)
Pelican Point, Namibia 8.13 mm (0.32 in)
El Arab (Aoulef), Algeria 12.19 mm (0.48 in)
ten wettest places on Earth (average annual precipitation): Mawsynram, India 11,871 mm (467.4 in)
Cherrapunji, India 11,777 mm (463.7 in)
Tutunendo, Colombia 11,770 mm (463.4 in)
Cropp River, New Zealand 11,516 mm (453.4 in)
San Antonia de Ureca, Equatorial Guinea 10,450 mm (411.4 in)
Debundsha, Cameroon 10,299 mm (405.5 in)
Big Bog, US (Hawaii) 10,272 mm (404.4 in)
Mt Waialeale, US (Hawaii) 9,763 mm (384.4 in)
Kukui, US (Hawaii) 9,293 mm (365.9 in)
Emeishan, China 8,169 mm (321.6 in)
ten coldest places on Earth (lowest average monthly temperature): Verkhoyansk, Russia (Siberia) -47°C (-53°F) January
Oymyakon, Russia (Siberia) -46°C (-52°F) January
Eureka, Canada -38.4°C (-37.1°F) February
Isachsen, Canada -36°C (-32.8°F) February
Alert, Canada -34°C (-28°F) February
Kap Morris Jesup, Greenland -34°C (-29°F) March
Cornwallis Island, Canada -33.5°C (-28.3°F) February
Cambridge Bay, Canada -33.5°C (28.3°F) February
Ilirnej, Russia -33°C (-28°F) January
Resolute, Canada -33°C (-27.4°F) February
ten hottest places on Earth (highest average monthly temperature): Death Valley, US (California) 39°C (101°F) July
Iranshahr, Iran 38.3°C (100.9°F) June
Ouallene, Algeria 38°C (100.4°F) July
Kuwait City, Kuwait 37.7°C (100°F) July
Medina, Saudi Arabia 36°C (97°F) July
Buckeye, US (Arizona) 34°C (93°F) July
Jazan, Saudi Arabia 33°C (91°F) June
Al Kufrah, Libya 31°C (87°F) July
Alice Springs, Australia 29°C (84°F) January
Tamanrasset, Algeria 29°C (84°F) June
Terrain
a compilation of terrain extremes can be found in the World elevation entry; the world's ocean floors also display wide variation, as explained in the bathymetry and major ocean currents entries under each of the five ocean entries (Arctic, Atlantic, Indian, Pacific, and Southern)
top ten world caves: compiled from Geography - note(s) under country entries
largest cave: Son Doong in Phong Nha-Ke Bang National Park, Vietnam, is the world's largest cave (greatest cross sectional area) and is the largest known cave passage by volume; it currently measures a total of 38.5 million cu m (about 1.35 billion cu ft); it connects to Thung cave, but not yet officially -- when recognized, it will add an additional 1.6 million cu m in volume
largest ice cave: the Eisriesenwelt (Ice Giants World) inside the Hochkogel mountain near Werfen, Austria, is the world's largest and longest ice cave system at 42 km (26 mi)
longest cave: Mammoth Cave in west-central Kentucky is the world's longest known cave system with more than 650 km (405 mi) of surveyed passageways
longest salt cave: the Malham Cave in Mount Sodom in Israel is the world's longest salt cave at 10 km (6 mi); its survey is not complete, so its recorded length will eventually increase
longest underwater cave: the Sac Actun cave system in Mexico is the longest underwater cave in the world at 348 km (216 mi), and the second-longest cave worldwide
longest lava tube cave: Kazumura Cave on the island of Hawaii is the world's longest and deepest lava tube cave; it has been surveyed at 66 km (41 mi) long and 1,102 m (3,614 ft) deep
deepest cave: Veryovkina Cave in the country of Georgia is the world's deepest cave at 2,212 m (7,257 ft)
deepest underwater cave: the Hranice Abyss in Czechia is the world's deepest surveyed underwater cave at 404 m (1,325 ft); its survey is not complete, and it could be 800-1,200 m deep
largest cave chamber: the Miao Room in the Gebihe cave system in China's Ziyun Getu He Chuandong National Park has about 10.78 million cu m (380.7 million cu ft) of volume
largest bat cave: Bracken Cave outside San Antonio, Texas, is the world's largest bat cave; an estimated 20 million Mexican free-tailed bats roost in the cave from March to October, making it the world's largest known concentration of mammals
bonus "cave" - the world's largest sinkhole: the Xiaoxhai Tiankeng sinkhole in Chongqing Municipality, China is 660 m deep, with a volume of 130 million cu m
Elevation
highest point: Mount Everest 8,849 m
lowest point: Denman Glacier (Antarctica) more than -3,500 m (in the oceanic realm, Challenger Deep in the Mariana Trench is the lowest point, lying -10,924 m below the surface of the Pacific Ocean)
mean elevation: 840 m
top ten highest mountains (measured from sea level): Mount Everest (China-Nepal) 8,849 m; K2 (China-Pakistan) 8,611 m; Kanchenjunga (India-Nepal) 8,586 m; Lhotse (China-Nepal) 8,516 m; Makalu (China-Nepal) 8,485 m; Cho Oyu (China-Nepal) 8,188 m; Dhaulagiri (Nepal) 8,167 m; Manaslu (Nepal) 8,156 m; Nanga Parbat (Pakistan) 8,125 m; Annapurna (Nepal) 8,091 m;
note: Mauna Kea (United States) is the world's tallest mountain as measured from base to summit; the peak lies on the island of Hawaii, but its base begins more than 70 km offshore and at a depth of about 6,000 m; total height estimates range from 9,966 m to 10,203 m
top ten highest island peaks: Puncak Jaya (New Guinea) 4,884 m (Indonesia)*; Mauna Kea (Hawaii) 4,207 m (United States); Gunung Kinabalu (Borneo) 4,095 m (Malaysia)*; Yu Shan (Taiwan) 3,952 (Taiwan)*; Mount Kerinci (Sumatra) 3,805 m (Indonesia); Mount Erebus (Ross Island) 3,794 (Antarctica); Mount Fuji (Honshu) 3,776 m (Japan)*; Mount Rinjani (Lombok) 3,726 m (Indonesia); Aoraki-Mount Cook (South Island) 3,724 m (New Zealand)*; Pico de Teide (Tenerife) 3,718 m (Spain)*
* indicates the highest peak for that Factbook entry
highest point on each continent: Asia - Mount Everest (China-Nepal) 8,849 m; South America - Cerro Aconcagua (Argentina) 6,960 m; North America - Mount McKinley (United States) 6,190 m; Africa - Kilimanjaro (Tanzania) 5,895 m; Europe - El'brus (Russia) 5,633 m; Antarctica - Vinson Massif 4,897 m; Australia - Mount Kosciuszko 2,229 m
highest capital on each continent: South America - La Paz (Bolivia) 3,640 m; Africa - Addis Ababa (Ethiopia) 2,355 m; Asia - Thimphu (Bhutan) 2,334 m; North America - Mexico City (Mexico) 2,240 m; Europe - Andorra la Vella (Andorra) 1,023 m; Australia - Canberra (Australia) 605 m
lowest point on each continent: Antarctica - Denman Glacier more than -3,500 m; Asia - Dead Sea (Israel-Jordan) -431 m; Africa - Lac Assal (Djibouti) -155 m; South America - Laguna del Carbon (Argentina) -105 m; North America - Death Valley (United States) -86 m; Europe - Caspian Sea (Azerbaijan-Kazakhstan-Russia) -28 m; Australia - Lake Eyre -15
lowest capital on each continent: Asia - Baku (Azerbaijan) -28 m; Europe - Amsterdam (Netherlands) -2 m; Africa - Banjul (Gambia); Bissau (Guinea-Bissau), Conakry (Guinea), Djibouti (Djibouti), Libreville (Gabon), Male (Maldives), Monrovia (Liberia), Tunis (Tunisia), Victoria (Seychelles) 0 m; North America - Basseterre (Saint Kitts and Nevis), Kingstown (Saint Vincent and the Grenadines), Panama City (Panama), Port of Spain (Trinidad and Tobago), Roseau (Dominica), Saint John's (Antigua and Barbuda), Santo Domingo (Dominican Republic) 0 m; South America - Georgetown (Guyana) 0 m; Australia - Canberra (Australia) 605 m
Land use
agricultural land: 38% (2022 est.)
arable land: 10.7% (2022 est.)
permanent crops: 1.5% (2022 est.)
permanent pasture: 25.8% (2022 est.)
forest: 30.6% (2022 est.)
other: 31.4% (2022 est.)
Irrigated land
3,242,917 sq km (2012 est.)
Major lakes (area sq km)
top ten largest natural lakes: Caspian Sea (Azerbaijan, Iran, Kazakhstan, Russia, Turkmenistan) 374,000 sq km; Lake Superior (Canada, United States) 82,100 sq km; Lake Victoria (Kenya, Tanzania, Uganda) 62,940 sq km; Lake Huron (Canada, United States) 59,600 sq km; Lake Michigan (United States) 57,750 sq km; Lake Tanganyika (Burundi, Democratic Republic of the Congo, Tanzania, Zambia) 32,000 sq km; Great Bear Lake (Canada) 31,328 sq km; Lake Baikal (Russia) 31,500 sq km; Lake Malawi (Malawi, Mozambique, Tanzania) 22,490 sq km; Great Slave Lake (Canada) 28,568 sq km
note 1: the areas of the lakes are subject to seasonal variation; only the Caspian Sea is saline, the rest are fresh water
note 2: Lakes Huron and Michigan are technically a single lake because the flow of water between the Straits of Mackinac that connects the two lakes keeps their water levels at near-equilibrium; combined, Lake Huron-Michigan is the largest freshwater lake by surface area in the world
note 3: if ranked by water volume, the Caspian Sea would still be first, but it would be followed Lakes Baikal, Tanganyika, Superior, and Malawi; Lake Superior contains more water than the other four North American Great Lakes (Erie, Huron, Michigan, Ontario) combined
Major rivers (by length in km)
top ten longest rivers: Nile (Africa) 6,650 km; Amazon (South America) 6,436 km; Yangtze (Asia) 6,300 km; Mississippi-Missouri (North America) 6,275 km; Yenisey-Angara (Asia) 5,539 km; Huang He/Yellow (Asia) 5,464 km; Ob-Irtysh (Asia) 5,410 km; Congo (Africa) 4,700 km; Amur (Asia) 4,444 km; Lena (Asia) 4,400 km
note: there are 21 countries without rivers: three in Africa (Comoros, Djibouti, Libya), one in the Americas (Bahamas), eight in Asia (Bahrain, Kuwait, Maldives, Oman, Qatar, Saudi Arabia, United Arab Emirates, Yemen), three in Europe (Malta, Monaco, Holy See), and six in Oceania (Kiribati, Marshall Islands, Nauru, Niue, Tonga, Tuvalu); these countries also do not have natural lakes
Major watersheds (area sq km)
a watershed is a drainage basin on an area of land where precipitation collects and drains off into a common outlet, such as into a river, bay, or other body of water; oceans ultimately take in the drainage from 83% of all land area; the remaining 17% of the land drains into internal (endorheic) basins
The World Factbook lists 51 watersheds across 102 countries:
Asia - 18
Europe - 9
Africa - 9
North and Central America - 8
South America - 5
Australia - 2
all watersheds with an area of at least 500,000 sq km have been included, along with a number of smaller, regionally significant watersheds; together, these represent the surface hydrology water flows that are the world's primary sources of fresh water for individual consumption, industry, and agriculture
Major aquifers
aquifers are underground layers of water-bearing permeable rock formations; groundwater from aquifers can be extracted using a water well
The World Factbook lists 37 major aquifers across 52 countries:
Africa - 13
Asia - 10
North America - 5
South America - 3
Europe - 4
Australia -2
these aquifers contain the bulk of the stored volume of groundwater; this represents more than 30% of the world's fresh water; in the US, groundwater is primarily used for irrigation; globally, 70% of the groundwater withdrawn is used for agriculture; groundwater also supplies almost half of all drinking water worldwide
Population distribution
six of the world's seven continents are widely and permanently inhabited; Asia is the most populous continent, with about 60% of the world's population (China and India together account for over 35%); Africa comes in second with over 15%, Europe has about 10%, North America 8%, South America almost 6%, and Oceania less than 1%; the harsh conditions on Antarctica prevent any permanent habitation
Natural hazards
large areas of the world are subject to severe weather and natural disasters (cyclones, earthquakes, landslides, tsunamis, volcanic eruptions, etc.)
volcanism: this is a driver and consequence of plate tectonics, the physical process reshaping the Earth's lithosphere; the world is home to more than 1,500 potentially active volcanoes, with over 500 of these erupting in recorded history; an estimated 500 million people live near volcanoes; associated dangers include lava flows, mud flows, pyroclastic flows, ash clouds, ash fall, ballistic projectiles, gas emissions, landslides, earthquakes, and tsunamis; in the 1990s, the International Association of Volcanology and Chemistry of the Earth's Interior created a list of 16 "Decade Volcanoes" with great potential for destruction: Avachinsky-Koryaksky (Russia), Colima (Mexico), Etna (Italy), Galeras (Colombia), Mauna Loa (US), Merapi (Indonesia), Nyiragongo (Democratic Republic of the Congo), Rainier (US), Sakurajima (Japan), Santa Maria (Guatemala), Santorini (Greece), Taal (Philippines), Teide (Spain), Ulawun (Papua New Guinea), Unzen (Japan), Vesuvius (Italy)
volcano statistics:
countries with the most volcanoes: (Holocene Epoch, the past 12,000 years*): United States (162), Japan (122), Indonesia (120), Russia (117), Chile (91);
*roughly 1,350 volcanoes have erupted over this time period; about 40-50 eruptions are ongoing at any one time; the frequency of volcanoes has not increased
longest erupting volcano: Santa Maria volcano in Guatemala has been constantly erupting since 22 June 1922; the Yasur volcano on Tanna Island in Vanuatu has been in constant activity since Captain Cook observed it in 1774, but it is not cited due to lack of a clear start date; tephra stratigraphy and radiocarbon dating show that the Yasur activity may have begun ca. A.D. 1270
highest volcano (above sea level): Nevado Ojos del Salado (6,893 m; 22,615 ft) on the Chile-Argentina border is the world's highest volcano above sea level and the highest peak in Chile
highest volcano (from base): Mauna Kea (US) is the world's tallest mountain, measured from base to summit; the peak lies on the island of Hawaii, but its base begins more than 70 km (43 mi) offshore and at a depth of about 6,000 m; total height estimates range from 9,966 m to 10,203 m
earthquakes: the vast majority of earthquakes occur in three large zones; the Circum-Pacific Belt (known as the Ring of Fire) borders the Pacific and is the largest zone of volcanic and seismic activity, with about 90% of earthquakes (81% of the largest) and about 75% of active volcanoes; the belt extends northward from Chile along the South American coast, then through Central America, Mexico, the western US, southern Alaska, and the Aleutian Islands, to Japan, the Philippines, Papua New Guinea, the southwestern Pacific, and New Zealand; the Alpide Belt extends from Java to Sumatra, northward along the mountains of Burma, eastward through the Himalayas and the Mediterranean, and into the Atlantic Ocean, accounting for about 17% of the largest earthquakes; the third belt follows the long Mid-Atlantic Ridge
Wonders of the World
The Seven Wonders of the Ancient World:
The conquests of Alexander the Great (r. 336-323 B.C.) in the fourth century B.C. fostered the spread of Greek culture to the lands around the eastern Mediterranean and much of the Middle East, ushering in what is today referred to as the Hellenistic Period (323-31 B.C.). Hellenistic sightseers compiled guidebooks with outstanding monuments in those parts of the world, including Persia, Egypt, and Babylon. Seven sites were usually emphasized since that number was considered magical, perfect, and complete. Not all wonders lists from ancient times agreed, but six sites consistently appeared (the Walls of Babylon sometimes substituted for the Lighthouse of Alexandria). The “classic” Seven Wonders most often cited are listed below.
1. The Great Pyramid of Egypt
The oldest of the Seven Wonders, the Great Pyramid, is the only one that remains largely intact. Commissioned by the Pharaoh Khufu (r. ca. 2589-2566 B.C.), it is the largest of the three pyramids at Giza. It served as the ruler’s tomb and was built over a period of about 20 years, concluding around 2560 B.C. The pyramid is estimated to have been 146.5 m tall when completed and was the tallest man-made structure in the world for over 3,800 years (until the 14th century A.D.). Most of the original limestone casing stones that formed the outer smooth surface of the pyramid are gone. Today, the pyramid’s height is about 139 m.
2. The Hanging Gardens of Babylon
This is the only one of the ancient Seven Wonders for which a definitive location has never been established. No surviving Babylonian texts mention the Gardens, nor have any archeological remains been discovered in today’s Iraq. According to tradition, the gardens were a remarkable feat of engineering, with an ascending series of mud-brick-tiered gardens containing a variety of trees, shrubs, and vines that, when viewed from below, resembled a leafy green mountain. The Gardens are frequently attributed to the Neo-Babylonian King Nebuchadnezzar II (r. 605-562 B.C.), who may have had them built for his Median wife, Queen Amytis, because she missed the green hills and valleys of her homeland.
3. The Temple of Artemis (Artemision) at Ephesus
This Greek temple at Ephesus (3 km southwest of Selcuk in present-day western Turkey) was dedicated to the goddess Artemis and was completely rebuilt twice: once after a 7th century B.C. flood and then after a 356 B.C. act of arson. In its final form, it was judged to be one of the Seven Wonders and survived for 600 years. The building was composed entirely of marble, with massive dimensions reported to be 130 m by 69 m, and included 127 columns, each about 18 m tall. The temple was damaged in a Gothic raid in A.D. 268, and Christians finally closed it in the early-to-mid 5th century. The structure was dismantled in succeeding centuries, and today almost nothing of the temple remains.
4. The Mausoleum of Halicarnassus
Constructed in about 350 B.C., the Mausoleum of Halicarnassus was located on the site of the present-day city of Bodrum in southwestern Turkey. It was the tomb of Mausolus, a Persian ruler, and his wife -- the term "mausoleum" is derived from his name. The structure stood about 45 m high and took about 20 years to complete. A series of earthquakes between the 12th and 15th centuries A.D. devastated the structure, which was the last of the original Seven Wonders to be destroyed.
5. The Colossus of Rhodes
This statue of the Greek sun god Helios, constructed at the entrance to Rhodes' harbor to celebrate the city's successful repulse of a siege, was made of iron tie bars to which brass or bronze plates were attached to form a skin. Contemporary descriptions list its height at about 70 cubits, or 33 m – approximately the same height as the Statue of Liberty (34 m) – which would make it the tallest statue in the ancient world. Completed in about 280 B.C., the monument stood for only about 54 years until it toppled in an earthquake in 226 B.C. The remains lay on the ground for over 800 years before finally being sold for scrap.
6. The Lighthouse (Pharos) of Alexandria
Completed around 275 B.C., the lighthouse stood on Pharos Island at the entrance to the Egyptian port city of Alexandria for about 1,600 years. Three earthquakes severely damaged it between A.D. 956 and 1323, when it was deactivated. The shape of the structure appeared on a number of ancient coins: a solid square base, which made up about half the height, supported an octagonal middle section and a cylindrical top. The height of the structure is thought to have been between 100 m (328 ft) and 140 m (459 ft). A mirror at its apex reflected sunlight during the day, and a fire burned at night.
7. The Statue of Zeus at Olympia in Greece
The giant seated statue of the king of the Greek gods in the sanctuary of Olympia was completed by the Greek sculptor Phidias in about 435 B.C. Roughly 13 m (43 ft) tall, it was constructed of ivory plates and gold panels on a wooden framework, and the god’s throne was ornamented with ebony, ivory, gold, and precious stones. With the rise of Christianity, the sanctuary at Olympia fell into disuse; the details of the statue’s final destruction are unknown.
note: The Lighthouse of Alexandria may have been the last of the wonders to be completed (ca. 275 B.C.), and the Colossus of Rhodes was the first to be destroyed in about 226 B.C., so the Seven Wonders existed at the same time for only about 50 years in the middle of the third century B.C.
The New Seven Wonders of the World:
A private initiative to come up with a new list of seven of the world’s wonders sprang up early in the new millennium. Worldwide balloting -- via internet or telephone -- included a list of 200 existing monuments. Over 100 million votes were reportedly cast over a period of several years, and the final list below was announced on 7 July 2007 (7-7-2007). The seven are inscribed as UNESCO World Heritage Sites.
1. Chichen Itza, Yucatan, Mexico
This archeological site includes the impressive remains of a large pre-Columbian Mayan city that flourished around A.D. 600-1100. Among the structures at the site are the massive Temple of the Warriors complex, an observatory (El Caracol), the Great Ball Court, and the Sacred Cenote (sinkhole) where offerings were made. The most famous building is the step-pyramid known as the Temple of Kukulcan that dominates the center of the site and serves as the symbol of Chichen Itza. The pyramidal structure is 24 m (79 ft) high; the crowning temple adds another 6 m (20 ft). Located in the dense jungles of Yucatan, it is one of the most visited tourist sites in Mexico.
2. The Colosseum, Rome, Italy
The Roman Emperor Vespasian began construction on the Colosseum in A.D. 72, and his son Titus completed it in A.D. 80, with Domitian (A.D. 81-96) making further modifications. The three emperors make up the Flavian Dynasty, and the structure is also known as the Flavian Amphitheater. It is estimated to have seated about 65 thousand spectators and was most famously used for gladiatorial contests and public spectacles. Earthquakes and thieves destroyed much of the original structure, but it remains an iconic symbol of Rome. The Colosseum is one of the most popular tourist attractions in the world.
3. Christ the Redeemer Statue, Rio de Janeiro, Brazil
Built between 1922 and 1931, the 30-m (98-ft) sculpture is reputed to be the largest Art Deco statue in the world. Its pedestal provides another 8 m (26 ft) in height, and the arms stretch out to 28 m (92 ft). Built of reinforced concrete and soapstone, the statue has become a cultural icon of both Rio and Brazil.
4. Great Wall, China
The name refers to a series of fortification systems that stretched across China's northern historical borders and served as protection against nomadic peoples. An archeological survey revealed that the wall and its associated branches measure 21,196 km (13,171 mi). The earliest of the walls date to the 7th century B.C.; stretches began to be linked in the 3rd century B.C., and successive dynasties added to or maintained sections of the walls. The best-known and best-preserved parts of the wall were built during the Ming Dynasty (1368-1644). The Great Wall is acknowledged as one of the most impressive architectural feats in history.
5. Machu Picchu, Cuzco Region, Peru
The Inca citadel of Machu Picchu, situated on a 2,430 m (7,972 ft) Andean mountain ridge, is now thought to have been erected as an estate for the Inca Emperor Pachacuti (r. 1438-1471) and may have also served as a religious sanctuary. Built between about 1450 and 1460, it was abandoned a century later, at the time of the Spanish conquest. It was built in the classic Inca style, using polished, fitted, dry-stone walls, and was home to about 750 people, mostly support staff to the nobility. The religious monuments include the Intiwatana, a carved ritual stone that was a kind of sundial and is referred to as “The Hitching Post of the Sun,” the Torreon or Temple of the Sun, and the Intimachay, a sacred cave.
6. Petra, Ma’an, Jordan
Petra is believed to have been established in the 4th century B.C. as the capital of the Nabataean Kingdom, an entity that grew wealthy as the nexus of trade routes in the southern Levant. The Roman Empire annexed it in A.D. 106. The city is famous for its carved-rock architecture and water conduit system, which allowed the Nabataeans to create an artificial oasis. The city may have had a population of 20,000 at its peak in the first century A.D.
7. Taj Mahal, Agra, Uttar Pradesh, India
This ivory-white mausoleum was commissioned in 1632 by Shah Jahan (r. 1628-1658) as the final resting place for his favorite wife, Mumtaz Mahal. The building also houses the tomb of Shah Jahan himself. The Taj Mahal is the centerpiece of a 17-hectare (42-acre) complex that includes a guest house, a mosque, and formal gardens. The project was completed in 1653.
note: The Great Pyramid of Egypt, the only surviving wonder of the ancient seven, received honorary status on the New Seven Wonders list.
Geography - note
note: the Earth is now thought to be about 4.55 billion years old, about one-third of the 13.8-billion-year age estimated for the universe; the earliest widely accepted date for life appearing on Earth is 3.48 billion years ago
People and Society
Population
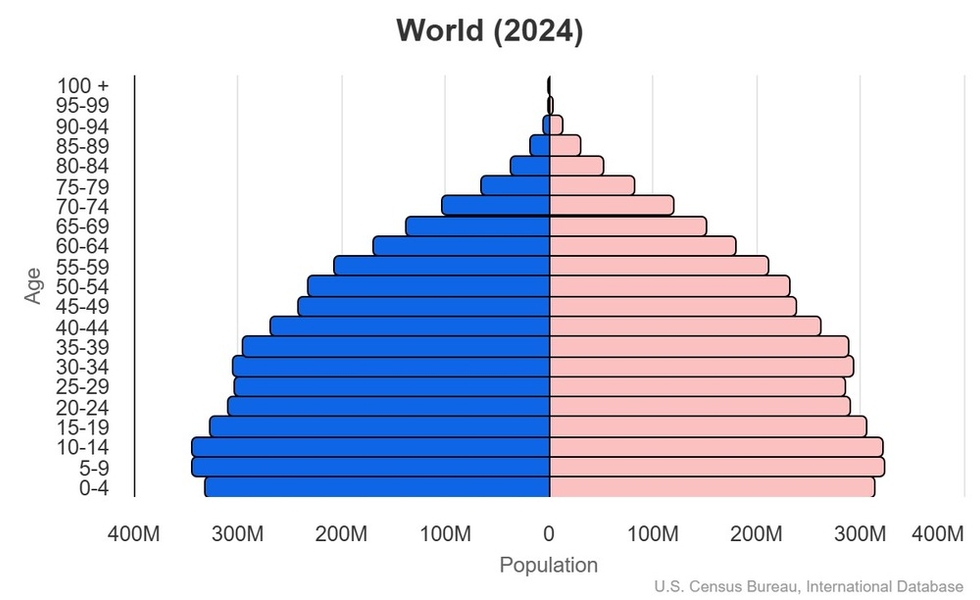
total: 8,057,236,243 (2024 est.)
male: 4,046,854,454
female: 4,010,381,789
Languages
most-spoken language: English 18.8%, Mandarin Chinese 13.8%, Hindi 7.5%, Spanish 6.9%, French 3.4%, Arabic 3.4%, Bengali 3.4%, Russian 3.2%, Portuguese 3.2%, Urdu 2.9% (2022 est.)
most-spoken first language: Mandarin Chinese 12.3%, Spanish 6%, English 5.1%, Arabic 5.1%, Hindi 3.5%, Bengali 3.3%, Portuguese 3%, Russian 2.1%, Japanese 1.7%, Punjabi, Western 1.3%, Javanese 1.1% (2018 est.)
note 1: the six UN languages -- Arabic, Chinese (Mandarin), English, French, Russian, and Spanish (Castilian) -- are the mother tongue or second language of about 49.6% of the world's population (2022), and are the official languages in more than half the states in the world; some 400 languages have more than a million first-language speakers (2018)
note 2: all told, there are estimated to be 7,168 living languages spoken in the world (2023); approximately 80% of these languages are spoken by fewer than 100,000 people; about 150 languages are spoken by fewer than 10 people; communities that are isolated in mountainous regions often develop multiple languages -- Papua New Guinea, for example, boasts about 840 separate languages (2018)
note 3: approximately 2,300 languages are spoken in Asia; 2,140, in Africa; 1,310 in the Pacific; 1,060 in the Americas; and 290 in Europe (2020)
Religions
Christian 31.1%, Muslim 24.9%, Hindu 15.2%, Buddhist 6.6%, folk religions 5.6%, Jewish <1%, other <1%, unaffiliated 15.6% (2020 est.)
Age structure
0-14 years: 24.5% (male 1,018,005,046/female 958,406,907)
15-64 years: 65.2% (male 2,658,595,672/female 2,592,930,538)
65 years and over: 10.3% (2024 est.) (male 370,253,736/female 459,044,344)

Dependency ratios
total dependency ratio: 53.4 (2024 est.)
youth dependency ratio: 37.7 (2024 est.)
elderly dependency ratio: 15.7 (2024 est.)
potential support ratio: 6.4 (2024 est.)
Median age
total: 31 years (2020 est.)
male: 30.3 years
female: 31.8 years
Population growth rate
1.03% (2021 est.)
note: this rate results in about 154 net additions to the worldwide population every minute or 2.6 people every second
Birth rate
17 births/1,000 population (2024 est.)
note: this rate results in about 260 worldwide births per minute or 4.3 births every second
Death rate
7.9 deaths/1,000 population (2024 est.)
note: this rate results in about 121 worldwide deaths per minute or 2 deaths every second
Population distribution
six of the world's seven continents are widely and permanently inhabited; Asia is the most populous continent, with about 60% of the world's population (China and India together account for over 35%); Africa comes in second with over 15%, Europe has about 10%, North America 8%, South America almost 6%, and Oceania less than 1%; the harsh conditions on Antarctica prevent any permanent habitation
Urbanization
urban population: 57.5% of total population (2023)
rate of urbanization: 1.73% annual rate of change (2020-25 est.)
Major urban areas - population
ten largest urban agglomerations: Tokyo (Japan) - 37,393,000; New Delhi (India) - 30,291,000; Shanghai (China) - 27,058,000; Sao Paulo (Brazil) - 22,043,000; Mexico City (Mexico) - 21,782,000; Dhaka (Bangladesh) - 21,006,000; Cairo (Egypt) - 20,901,000; Beijing (China) - 20,463,000; Mumbai (India) - 20,411,000; Osaka (Japan) - 19,165,000 (2020)
ten largest urban agglomerations, by continent:
Africa - Cairo (Egypt) - 20,901,000; Lagos (Nigeria) - 134,368,000; Kinshasha (DRC) - 14,342,000; Luanda (Angola) - 8,330,000; Dar Es Salaam (Tanzania) - 6,702,000; Khartoum (Sudan) - 5,829,000; Johannesburg (South Africa) - 5,783,000; Alexandria (Egypt) - 5,281,000; Abidjan (Cote d'Ivoire) - 5,203,000; Addis Ababa (Ethiopia) - 4,794,000
Asia - Tokyo (Japan) - 37,393,000; New Delhi (India) - 30,291,000; Shanghai (China) - 27,058,000; Dhaka (Bangladesh) - 21,006,000; Beijing (China) - 20,463,000; Mumbai (India) - 20,411,000; Osaka (Japan) - 19,165,000; Karachi (Pakistan) - 16,094,000; Chongqing (China) - 15,872,000; Istanbul (Turkey) - 15,190,000
Europe - Moscow (Russia) - 12,538,000; Paris (France) - 11,017,000; London (United Kingdom) - 9,304,000; Madrid (Spain) - 6,618,000; Barcelona (Spain) - 5,586,000, Saint Petersburg (Russia) - 5,468,000; Rome (Italy) - 4,257,000; Berlin (Germany) - 3,562,000; Athens (Greece) - 3,153,000; Milan (Italy) - 3,140,000
North America - Mexico City (Mexico) - 21,782,000; New York-Newark (United States) - 18,804,000; Los Angeles-Long Beach-Santa Ana (United States) - 12,447,000; Chicago (United States) - 8,865,000; Houston (United States) - 6,371,000; Dallas-Fort Worth (United States) - 6,301,000; Toronto (Canada) - 6,197,000; Miami (United States) - 6,122,000; Atlanta (United States) - 5,803,000; Philadelphia (United States) - 5,717,000
Oceania - Melbourne (Australia) - 4,968,000, Sydney (Australia) - 4,926,000; Brisbane (Australia) - 2,406,000; Perth (Australia) - 2,042,000; Auckland (New Zealand) - 1,607,000; Adelaide (Australia) - 1,336,000; Gold Coast-Tweed Head (Australia) - 699,000; Canberra (Australia) - 457,000; Newcastle-Maitland (Australia) - 450,000; Wellington (New Zealand) - 415,000
South America - Sao Paulo (Brazil) - 22,043,000; Buenos Aires (Argentina) - 15,154,000; Rio de Janeiro (Brazil) - 13,458,000; Bogota (Colombia) - 10,978,000; Lima (Peru) - 10,719,000; Santiago (Chile) - 6,767,000; Belo Horizonte (Brazil) - 6,084,000; Brasilia (Brazil) - 4,646,000; Porto Alegre (Brazil) - 4,137,000; Recife (Brazil) - 4,127,000 (2020)
Sex ratio
at birth: 1.05 male(s)/female
0-14 years: 1.05 male(s)/female
15-64 years: 1.03 male(s)/female
65 years and over: 0.81 male(s)/female
total population: 1.01 male(s)/female (2024 est.)
Maternal mortality ratio
197 deaths/100,000 live births (2023 est.)
Infant mortality rate
total: 28.3 deaths/1,000 live births (2024 est.)
Life expectancy at birth
total population: 70.5 years (2020)
male: 68.4 years
female: 72.6 years
Total fertility rate
2.42 children born/woman (2020 est.)
Drinking water source
improved:
urban: 97.9% of population (2022 est.)
rural: 84% of population (2022 est.)
total: 91.8% of population (2022 est.)
unimproved:
urban: 2.1% of population (2022 est.)
rural: 16% of population (2022 est.)
total: 8.2% of population (2022 est.)
Health expenditure
10.4% of GDP (2021)
Sanitation facility access
improved:
urban: 88.9% of population (2022 est.)
rural: 70.1% of population (2022 est.)
total: 80.8% of population (2022 est.)
unimproved:
urban: 11.1% of population (2022 est.)
rural: 29.9% of population (2022 est.)
total: 19.2% of population (2022 est.)
Children under the age of 5 years underweight
12.3% (2022)
Currently married women (ages 15-49)
66.2% (2023 est.)
Child marriage
women married by age 15: 4.3% (2023)
women married by age 18: 18.7% (2023)
men married by age 18: 2.7% (2022)
Environment
Environmental issues
large areas of the world are subject to overpopulation, industrial disasters, pollution (air, water, acid rain, toxic substances), loss of vegetation (overgrazing, deforestation, desertification), loss of biodiversity; soil degradation, soil depletion, erosion; ozone layer depletion; waste disposal; temperature change
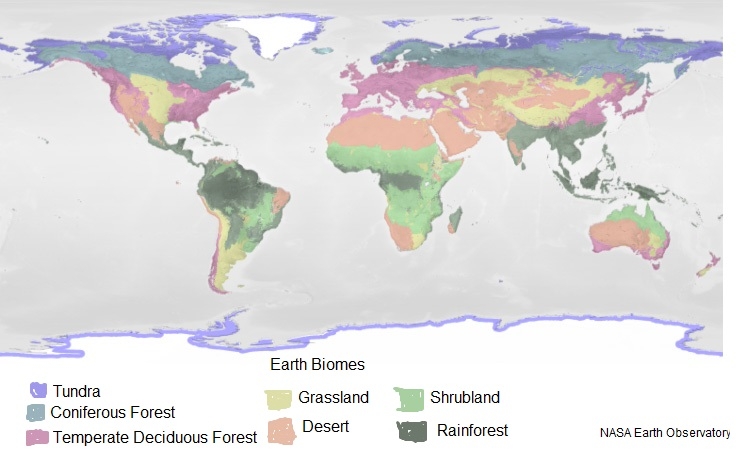
World biomes
Types of biomes: A biome is a biogeographical designation describing a biological community of plants and animals that has formed in response to a physical environment and a shared regional climate. Biomes can extend over more than one continent. Different classification systems define different numbers of biomes. The World Factbook recognizes the following seven biomes used by NASA: tundra, coniferous forest, temperate deciduous forest, rainforest, grassland, shrubland, and desert.
Tundra biome: The tundra is the coldest of the biomes. It also receives low amounts of precipitation, making the tundra similar to a desert. Tundra comes from the Finnish word tunturia, meaning "treeless plain." Tundra is found in the regions just below the ice caps of the Arctic, extending across North America to Europe and to Siberia in Asia. Temperatures usually range between -40°C (-40 °F) and 18°C (64°F). The temperatures are so cold that there is a layer of permanently frozen ground below the surface, called permafrost. This permafrost is a defining characteristic of the tundra biome. In the tundra summers, the top layer of soil thaws only a few inches down, providing a growing surface for the roots of vegetation. This biome sees 150 to 250 mm (6 to 10 in) of rain per year. Vegetation in the tundra has adapted to the cold and the short growing season and consists of lichens, mosses, grasses, sedges, and shrubs, but almost no trees.
Coniferous forest biome: The coniferous forest is sandwiched between the tundra to the north and the deciduous forest to the south. Coniferous forest regions have long, cold, snowy winters; warm, humid summers; well-defined seasons; and at least four to six frost-free months. The average temperature in winter ranges from -40°C (-40°F) to 20°C (68°F). The average summer temperatures are usually around 10°C (50°F). 300 to 900 mm (12 to 35 in) of rain per year can be expected in this biome. Vegetation consists of trees that produce cones and needles, which are called coniferous-evergreen trees. Some needles remain on the trees all year long. Some of the more common conifers are spruces, pines, and firs.
Temperate deciduous forest biome: Temperate deciduous forests are located in the mid-latitude areas, which means that they are found between the polar regions and the tropics. The deciduous forest regions are exposed to warm and cold air masses, which cause this area to have four seasons. Hot summers and cold winters are typical. The average daily temperatures range between -30°C (-22°F) and 30°C (86°F), with a yearly average of 10°C (50°F). On average, this biome receives 750 to 1,500 mm (30 to 59 in) of rain per year. Vegetation includes broadleaf trees (oaks, maples, beeches), shrubs, perennial herbs, and mosses.
Rainforest biome: The rainforest biome remains warm all year and stay frost-free. The average daily temperatures range from 20°C (68°F) to 25°C (77°F). Rainforests receive the most yearly rainfall of all of the biomes, and a typical year sees 2,000 to 10,000 mm (79 to 394 in) of rain. Vegetation typically includes vines, palm trees, orchids, and ferns. There are two types of rainforests: tropical rainforests are found closer to the equator, and temperate rainforests are found farther north near coastal areas. The majority of common houseplants come from the rainforest.
Grassland biome: Grasslands are open, continuous, and fairly flat areas of grass. Found on every continent except Antarctica, they are often located between temperate forests at high latitudes and deserts at subtropical latitudes. Depending on latitude, the annual temperature range can be -20°C (-4°F) to 30°C (86°F). Grasslands receive around 500 to 900 mm (20 to 35 in) of rain per year. Tropical grasslands have dry and wet seasons that remain warm all the time. Temperate grasslands have cold winters and warm summers with some rain. Vegetation is dominated by grasses but can include sedges and rushes, along with some legumes (clover) and herbs. A few trees may be found in this biome along the streams, but not many due to the lack of rainfall.
Shrubland biome: Shrublands include chaparral, woodland, and savanna, and are composed of shrubs or short trees. Many shrubs thrive on steep, rocky slopes, but there is usually not enough rain to support tall trees. Shrublands are located in west coastal regions between 30° and 40° North and South latitude and are usually found on the borders of deserts and grasslands. The summers are hot and dry with temperatures up to 38°C (100°F). Winters are cool and moist, with temperatures around -1 °C (30°F). Annual rainfall in the shrublands varies greatly, but 200 to 1,000 mm (8 to 40 in) of rain per year can be expected. Vegetation includes aromatic herbs (sage, rosemary, thyme, oregano), shrubs, acacia, chamise, grasses. Plants have adapted to fire caused by frequent lightning strikes in the summer.
Desert biome: The most important characteristic of a desert biome is that it receives very little rainfall, usually about 250 mm (10 in) of rain per year. During the day, desert temperatures rise to an average of 38°C (100°F). At night, desert temperatures fall to an average of -4°C (about 25°F). Vegetation is sparse, consisting of cacti, small bushes, and short grasses. Perennials survive for several years by becoming dormant and flourishing when water is available. Annuals are referred to as ephemerals because some can complete an entire life cycle in weeks. Since desert conditions are so severe, the plants that live there need to adapt to compensate. Some, such as cacti, store water in their stems and use it very slowly, while others, like bushes, conserve water by growing few leaves or by having large root systems to gather water.


Climate
a wide equatorial band of hot and humid tropical climates is bordered north and south by subtropical temperate zones that separate two large areas of cold and dry polar climates
ten driest places on Earth (average annual precipitation): McMurdo Dry Valleys, Antarctica 0 mm (0 in)
Arica, Chile 0.76 mm (0.03 in)
Al Kufrah, Libya 0.86 mm (0.03 in)
Aswan, Egypt 0.86 mm (0.03 in)
Luxor, Egypt 0.86 mm (0.03 in)
Ica, Peru 2.29 mm (0.09 in)
Wadi Halfa, Sudan 2.45 mm (0.1 in)
Iquique, Chile 5.08 mm (0.2 in)
Pelican Point, Namibia 8.13 mm (0.32 in)
El Arab (Aoulef), Algeria 12.19 mm (0.48 in)
ten wettest places on Earth (average annual precipitation): Mawsynram, India 11,871 mm (467.4 in)
Cherrapunji, India 11,777 mm (463.7 in)
Tutunendo, Colombia 11,770 mm (463.4 in)
Cropp River, New Zealand 11,516 mm (453.4 in)
San Antonia de Ureca, Equatorial Guinea 10,450 mm (411.4 in)
Debundsha, Cameroon 10,299 mm (405.5 in)
Big Bog, US (Hawaii) 10,272 mm (404.4 in)
Mt Waialeale, US (Hawaii) 9,763 mm (384.4 in)
Kukui, US (Hawaii) 9,293 mm (365.9 in)
Emeishan, China 8,169 mm (321.6 in)
ten coldest places on Earth (lowest average monthly temperature): Verkhoyansk, Russia (Siberia) -47°C (-53°F) January
Oymyakon, Russia (Siberia) -46°C (-52°F) January
Eureka, Canada -38.4°C (-37.1°F) February
Isachsen, Canada -36°C (-32.8°F) February
Alert, Canada -34°C (-28°F) February
Kap Morris Jesup, Greenland -34°C (-29°F) March
Cornwallis Island, Canada -33.5°C (-28.3°F) February
Cambridge Bay, Canada -33.5°C (28.3°F) February
Ilirnej, Russia -33°C (-28°F) January
Resolute, Canada -33°C (-27.4°F) February
ten hottest places on Earth (highest average monthly temperature): Death Valley, US (California) 39°C (101°F) July
Iranshahr, Iran 38.3°C (100.9°F) June
Ouallene, Algeria 38°C (100.4°F) July
Kuwait City, Kuwait 37.7°C (100°F) July
Medina, Saudi Arabia 36°C (97°F) July
Buckeye, US (Arizona) 34°C (93°F) July
Jazan, Saudi Arabia 33°C (91°F) June
Al Kufrah, Libya 31°C (87°F) July
Alice Springs, Australia 29°C (84°F) January
Tamanrasset, Algeria 29°C (84°F) June
Land use
agricultural land: 38% (2022 est.)
arable land: 10.7% (2022 est.)
permanent crops: 1.5% (2022 est.)
permanent pasture: 25.8% (2022 est.)
forest: 30.6% (2022 est.)
other: 31.4% (2022 est.)
Urbanization
urban population: 57.5% of total population (2023)
rate of urbanization: 1.73% annual rate of change (2020-25 est.)
Carbon dioxide emissions
37.079 billion metric tonnes of CO2 (2023 est.)
from coal and metallurgical coke: 16.652 billion metric tonnes of CO2 (2023 est.)
from petroleum and other liquids: 12.463 billion metric tonnes of CO2 (2023 est.)
from consumed natural gas: 7.964 billion metric tonnes of CO2 (2023 est.)
Total renewable water resources
54 trillion cubic meters (2011 est.)
Government
Capital
time difference: there are 21 world entities (20 countries and 1 dependency) with multiple time zones: Australia, Brazil, Canada, Chile, Democratic Republic of Congo, Ecuador, France, Greenland (part of the Danish Kingdom), Indonesia, Kazakhstan, Kiribati, Mexico, Micronesia, Mongolia, Netherlands, New Zealand, Papua New Guinea, Portugal, Russia, Spain, United States
note 1: in some instances, the time zones pertain to portions of a country that lie overseas
note 2: in 1851, the British set their prime meridian (0° longitude) through the Royal Observatory at Greenwich, England; this meridian became the international standard in 1884 and thus the basis for the standard time zones of the world; today, GMT is officially known as Coordinated Universal Time (UTC) and is also referred to as "Zulu time"; UTC is the basis for all civil time, with the world divided into time zones expressed as positive or negative differences from UTC
note 3: each time zone is based on 15° starting from the prime meridian; in theory, there are 24 time zones based on the solar day, but there are now upward of 40 because of fractional hour offsets that adjust for various political and physical geographic realities; see the Standard Time Zones of the World map included with the World and Regional Maps
daylight saving time: some 67 countries -- including most of the world's leading industrialized nations -- use daylight savings time (DST) in at least a portion of the country; China, Japan, India, and Russia are major industrialized countries that do not use DST; Asia and Africa generally do not observe DST, and it is generally not observed near the equator, where sunrise and sunset times do not vary enough to justify it; some countries observe DST only in certain regions; only a minority of the world's population -- about 20% -- uses DST
Administrative divisions
197 countries, 69 dependent areas and other entities
Dependent areas
Australia dependencies: Ashmore and Cartier Islands, Christmas Island, Cocos (Keeling) Islands, Coral Sea Islands, Heard Island and McDonald Islands, Norfolk Island (6)
France dependencies: Clipperton Island, French Polynesia, French Southern and Antarctic Lands, New Caledonia, Saint Barthelemy, Saint Martin, Saint Pierre and Miquelon, Wallis and Futuna (8)
New Zealand dependency: Tokelau (1)
Norway dependencies: Bouvet Island, Jan Mayen, Svalbard (3)
United Kingdom dependencies: Anguilla; Bermuda; British Indian Ocean Territory; British Virgin Islands; Cayman Islands; Falkland Islands; Gibraltar; Montserrat; Pitcairn Islands; Saint Helena, Ascension, and Tristan da Cunha; South Georgia and the South Sandwich Islands; Turks and Caicos Islands (12)
United States dependencies: American Samoa, Baker Island, Guam, Howland Island, Jarvis Island, Johnston Atoll, Kingman Reef, Midway Islands, Navassa Island, Northern Mariana Islands, Palmyra Atoll, Puerto Rico, Virgin Islands, Wake Island (14)
Legal system
the legal systems of nearly all countries are modeled on elements of five main types: civil law (including French law, the Napoleonic Code, Roman law, Roman-Dutch law, and Spanish law), common law (including English and US law), customary law, mixed or pluralistic law, and religious law (including Islamic sharia law); an additional type of legal system -- international law -- governs the conduct of independent nations in their relationships with one another
International law organization participation
all UN members are parties to the statute that established the International Court of Justice (ICJ) or World Court; as of June 2025, 125 countries have also ratified or acceded to the Rome Statute of the International Criminal Court (ICCt), the treaty that established the ICCt (see the reference guide on International Organizations and Groups for differences between the ICJ and ICCt mandates)
Executive branch
chief of state: there are 27 countries with royal families in the world: most are in Asia (13) and Europe (10), three are in Africa, and one in Oceania; monarchies by continent are as follows: Asia (Bahrain, Bhutan, Brunei, Cambodia, Japan, Jordan, Kuwait, Malaysia, Oman, Qatar, Saudi Arabia, Thailand, United Arab Emirates); Europe (Belgium, Denmark, Liechtenstein, Luxembourg, Monaco, Netherlands, Norway, Spain, Sweden, United Kingdom); Africa (Eswatini, Lesotho, Morocco); Oceania (Tonga)
note 1: Andorra and the Holy See (Vatican) are also monarchies of a sort, but they are not ruled by royal houses; Andorra has two co-princes (the president of France and the bishop of Urgell) and the Holy See is ruled by an elected pope
note 2: the UK sovereign is also the monarch for the 14 Commonwealth countries (including Australia, Canada, Jamaica, New Zealand)
Legislative branch
230 political entities have legislative bodies; of these, 144 are unicameral (a single “house”) and 86 are bicameral (both upper and lower houses); 33 territories, possessions, or other special administrative units have their own governing bodies
Flag
a "World" flag does not exist, but the United Nations (UN) flag -- adopted on 7 December 1946 -- has sometimes been used to represent the entire planet; the flag displays the official UN emblem in white on a blue background; the emblem design shows a world map in an azimuthal equidistant projection centered on the North Pole, with the image flanked by two olive branches; blue was chosen to represent peace, in contrast to the red usually associated with war; the map projection includes all the continents except Antarctica
note 1: the flags of 12 nations -- Austria, Botswana, Georgia, Jamaica, Japan, Laos, Latvia, Micronesia, Nigeria, North Macedonia, Switzerland, and Thailand -- have no top or bottom and may be flown with either long edge on top
note 2: the most common colors found on national flags are as follows: red (~75%), white (~70%), and blue (~50%); these three colors are so prevalent that there are only two countries, Jamaica and Sri Lanka, that do not include one of them; the three next most popular colors are yellow/gold and green (both ~45%) and black (~30%)
note 3: flags composed of three colors are by far the most common type and, of those, the red-white-blue combination is the most widespread


National anthem(s)
title: almost every country has a national anthem (and Denmark and New Zealand have two); most anthems have lyrics, which are usually in the official language or the most common language of the country; countries with more than one official language sometimes offer several versions
note: the first anthem to be officially adopted (1795) was "La Marseillaise" (The Song of Marseille) of France; Japan claims to have the shortest anthem, "Kimigayo" (The Emperor's Reign), that consists of 11 measures; Japan's anthem has the world's oldest lyrics, dating to the 10th century or earlier; Greece has the anthem with the longest lyrics, "Ymnos eis tin Eleftherian" (Hymn to Liberty), with 158 stanzas; Uruguay has the anthem with the longest musical score, "Himno Nacional" (National Anthem of Uruguay), with 105 bars (almost five minutes)
National heritage
total World Heritage Sites: 1,223 (952 cultural, 231 natural, 40 mixed) (2024)
note: a summary of each country's UNESCO World Heritage sites can be found in the national heritage data field, under the Government category for the country
Economy
Real GDP (purchasing power parity)
$173.163 trillion (2024 est.)
$167.633 trillion (2023 est.)
$162.058 trillion (2022 est.)
note: data in 2021 dollars
Real GDP growth rate
2.9% (2024 est.)
2.9% (2023 est.)
3.4% (2022 est.)
note: annual GDP % growth based on constant local currency
Real GDP per capita
$21,300 (2024 est.)
$20,800 (2023 est.)
$20,300 (2022 est.)
note: data in 2021 dollars
GDP (official exchange rate)
$111.326 trillion (2024 est.)
note: data in current dollars at official exchange rate
Inflation rate (consumer prices)
3% (2024 est.)
5.9% (2023 est.)
7.9% (2022 est.)
note: annual % change based on consumer prices
GDP - composition, by sector of origin
agriculture: 4% (2024 est.)
industry: 26% (2024 est.)
services: 66.2% (2024 est.)
note: figures may not total 100% due to non-allocated consumption not captured in sector-reported data
GDP - composition, by end use
household consumption: 56.4% (2023 est.)
government consumption: 16.6% (2023 est.)
investment in fixed capital: 25.9% (2023 est.)
investment in inventories: 0.6% (2023 est.)
exports of goods and services: 29.1% (2023 est.)
imports of goods and services: -28.3% (2023 est.)
note: figures may not total 100% due to rounding or gaps in data collection
Agricultural products
the whole range of agricultural products
top ten agricultural products by global production tonnage: sugarcane, maize, rice, wheat, milk, oil palm fruit, potatoes, soybeans, cassava, vegetables (2023)
Industries
dominated by the onrush of technology, especially in computers, robotics, telecommunications, and medicines and medical equipment; most of these advances take place in OECD nations; only a small portion of non-OECD countries have succeeded in rapidly adjusting to these technological forces; the accelerated development of new technologies is complicating already grim environmental problems
Industrial production growth rate
2.9% (2024 est.)
note: annual % change in industrial value added based on constant local currency
Labor force
3.696 billion (2024 est.)
note: number of people ages 15 or older who are employed or seeking work
Unemployment rate
4.9% (2024 est.)
5% (2023 est.)
5.3% (2022 est.)
note: % of labor force seeking employment
Youth unemployment rate (ages 15-24)
total: 13.6% (2024 est.)
male: 13.2% (2024 est.)
female: 15.3% (2024 est.)
note: % of labor force ages 15-24 seeking employment
Remittances
0.7% of GDP (2024 est.)
0.8% of GDP (2023 est.)
0.8% of GDP (2022 est.)
note: personal transfers and compensation between resident and non-resident individuals/households/entities
Budget
revenues: $21.68 trillion (2017 est.)
expenditures: $23.81 trillion (2017 est.)
Taxes and other revenues
13.8% (of GDP) (2023 est.)
note: central government tax revenue as a % of GDP
Exports
$32.379 trillion (2024 est.)
$31.271 trillion (2023 est.)
$31.782 trillion (2022 est.)
note: balance of payments - exports of goods and services in current dollars
Exports - commodities
the whole range of industrial and agricultural goods and services
top ten commodities by share of world trade: crude petroleum, cars, refined petroleum, integrated circuits, broadcasting equipment, gold, natural gas, garments, vehicle parts/accessories, packaged medicine (2022)
Imports
$31.244 trillion (2024 est.)
$30.334 trillion (2023 est.)
$30.871 trillion (2022 est.)
note: balance of payments - imports of goods and services in current dollars
Imports - commodities
the whole range of industrial and agricultural goods and services
top ten - share of world trade: see listing for exports
Energy
Electricity access
electrification - total population: 91.4% (2022 est.)
electrification - urban areas: 97.7%
electrification - rural areas: 84%
Electricity
installed generating capacity: 9.08 billion kW (2023 est.)
consumption: 27.047 trillion kWh (2023 est.)
exports: 810.999 billion kWh (2023 est.)
imports: 804.542 billion kWh (2023 est.)
transmission/distribution losses: 2.053 trillion kWh (2023 est.)
Electricity generation sources
fossil fuels: 60.1% of total installed capacity (2023 est.)
nuclear: 9.2% of total installed capacity (2023 est.)
solar: 5.6% of total installed capacity (2023 est.)
wind: 8% of total installed capacity (2023 est.)
hydroelectricity: 14.4% of total installed capacity (2023 est.)
geothermal: 0.3% of total installed capacity (2023 est.)
biomass and waste: 2.4% of total installed capacity (2023 est.)
Nuclear energy
Number of operational nuclear reactors: 416 (2025)
Number of nuclear reactors under construction: 62 (2025)
Net capacity of operational nuclear reactors: 376.59GW (2025)
Number of nuclear reactors permanently shut down: 214 (2025)
Coal
production: 9.368 billion metric tons (2023 est.)
consumption: 9.382 billion metric tons (2023 est.)
exports: 1.494 billion metric tons (2023 est.)
imports: 1.507 billion metric tons (2023 est.)
proven reserves: 1.166 trillion metric tons (2023 est.)
Petroleum
total petroleum production: 99.887 million bbl/day (2023 est.)
refined petroleum consumption: 101.86 million bbl/day (2023 est.)
crude oil estimated reserves: 1.697 trillion barrels (2021 est.)
Natural gas
production: 4.143 trillion cubic meters (2023 est.)
consumption: 4.1 trillion cubic meters (2023 est.)
exports: 1.219 trillion cubic meters (2023 est.)
imports: 1.226 trillion cubic meters (2023 est.)
proven reserves: 206.683 trillion cubic meters (2021 est.)
Energy consumption per capita
73.108 million Btu/person (2023 est.)
Communications
Telephones - fixed lines
total subscriptions: 839.8 million (2024 est.)
subscriptions per 100 inhabitants: 11 (2023 est.)
Telephones - mobile cellular
total subscriptions: 9,144,200,000 (2024 est.)
subscriptions per 100 inhabitants: 112 (2024 est.)
Internet users
percent of population: 68% (2024 est.)
top ten countries by Internet usage (in millions): 854 China; 560 India; 293 United States; 171 Indonesia; 149 Brazil; 123 Nigeria; 119 Japan; 116 Russia; 96 Bangladesh; 88 Mexico (2023)
Broadband - fixed subscriptions
total: 1,495,600,000 (2023 est.)
subscriptions per 100 inhabitants: 18 (2022 est.)
note: the worldwide total of fixed broadband subscriptions has been higher than fixed telephony subscriptions since 2017
Transportation
Airports
47,242 (2025)
Heliports
21,741 (2025)
Railways
total: 1,148,186 km (2013)
Merchant marine
total: 103,577 (2023)
by type: bulk carrier 13,141, container ship 5,815, general cargo 19,918, oil tanker 11,604, other 53,099
Military and Security
Military expenditures
2.4% of GDP (2024 est.)
2.3% of GDP (2023 est.)
2.2% of GDP (2022 est.)
2.2% of GDP (2021 est.)
2.3% of GDP (2020 est.)
Military and security service personnel strengths
approximately 20 million active-duty military personnel worldwide (2025)
note: the largest militaries in the world based on personnel numbers belong to China, India, the US, North Korea, and Russia
Military equipment inventories and acquisitions
the US is the world's leading arms exporter (2024)
Military deployments
as of mid-2025, there were approximately 68,000 personnel deployed on UN peacekeeping missions worldwide (2025)
Transnational Issues
Trafficking in persons
tier rating:
Tier 2 Watch List: (25 countries) Algeria, Barbados, Bolivia, Brazil, Brunei, Burkina Faso, Cabo Verde, Democratic Republic of the Congo, Republic of Congo, Djibouti, Fiji, Hong Kong, Kyrgyzstan, Liberia, Maldives, Nepal, Niger, Rwanda, Saint Lucia, Solomon Islands, South Africa, Tunisia, Turkmenistan, Vanuatu, Zimbabwe (2025)
Tier 3: (20 countries) Afghanistan, Belarus, Burma, Cambodia, Chad, People's Republic of China, Cuba, Eritrea, Iran, Democratic People's Republic of Korea, Laos, Macau, Nicaragua, Papua New Guinea, Russia, Sint Maarten, South Sudan, Sudan, Syria, Venezuela (2025)